Customize Your Data Display with ErgData
Sep 12, 2022
Share

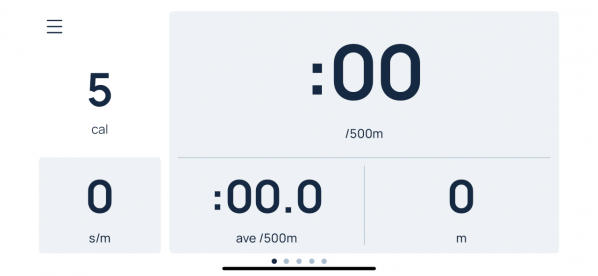
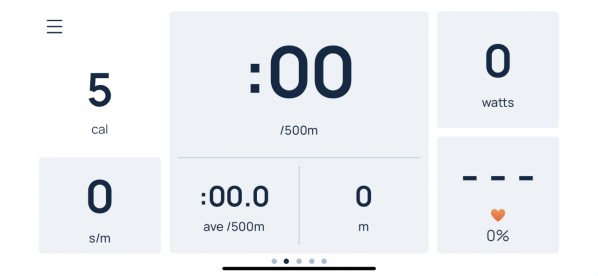
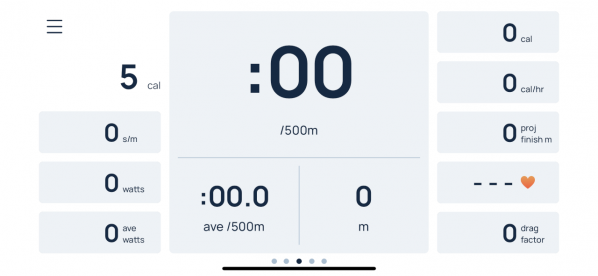
ErgData, Concept2’s free app, offers a choice of six different displays to view during your workout. Even better, it enables you to customize the data you see on them. There are three data screens, a plot screen, and a graph screen, and if you’re using the Target Pace function, you can view yourself side-by-side with your pacer. The three data screens offer the following numbers of data fields as shown in the images below. The central pane (three fields) are linked and can be changed to show units of pace, watts or calories. All other blue-shaded boxes can be set individually to any of the choices in the drop-down menu.
Small Data Screen
Medium Data Screen
Large Data Screen
How to Choose your Data
From any of the above data screens (small, medium or large) simply tap on any of the blue-shaded fields to see a list of all the data options you can choose from. Select the data you want to see, then tap “Save”. The one non-shaded field shows Duration (time, distance or calories). This is always displayed. ErgData will remember what you have chosen for each display, allowing you to customize each screen to suit you. You can change them again any time.
Here’s the full list of data display options:
Spm/rpm Stroke Count*
Heart Rate
Drag factor*
Interval Number
Time of Day*
Meters
Pace
Average Pace
Split Pace
Projected Finish
Watts
Average Watts
Accumulated Calories
Calories per Hour
Average Force*
Maximum Force*
Drive Length*
Drive Speed*
Drive Time*
*The asterisks denote the additional data that are available using ErgData.
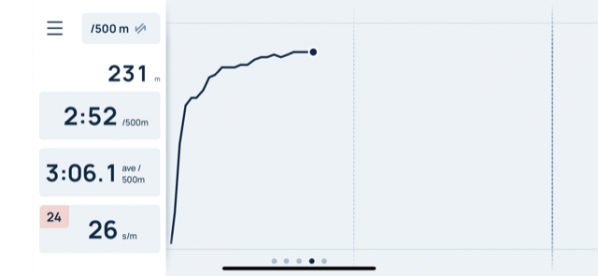
Beyond the three data screens, you can also choose to view a graph of your pace or a table of workout data for every split or interval of your workout. In addition, there’s a Pacer screen where you can see yourself racing against a pacer, driven either by a pace you have input, or a previous performance you wish to ReRow, ReSki or ReRide. While these graphic screens show less data, you can still choose the data you want to see by simply tapping on the blue-shaded box and choosing from the drop-down menu.
Pacer Screen
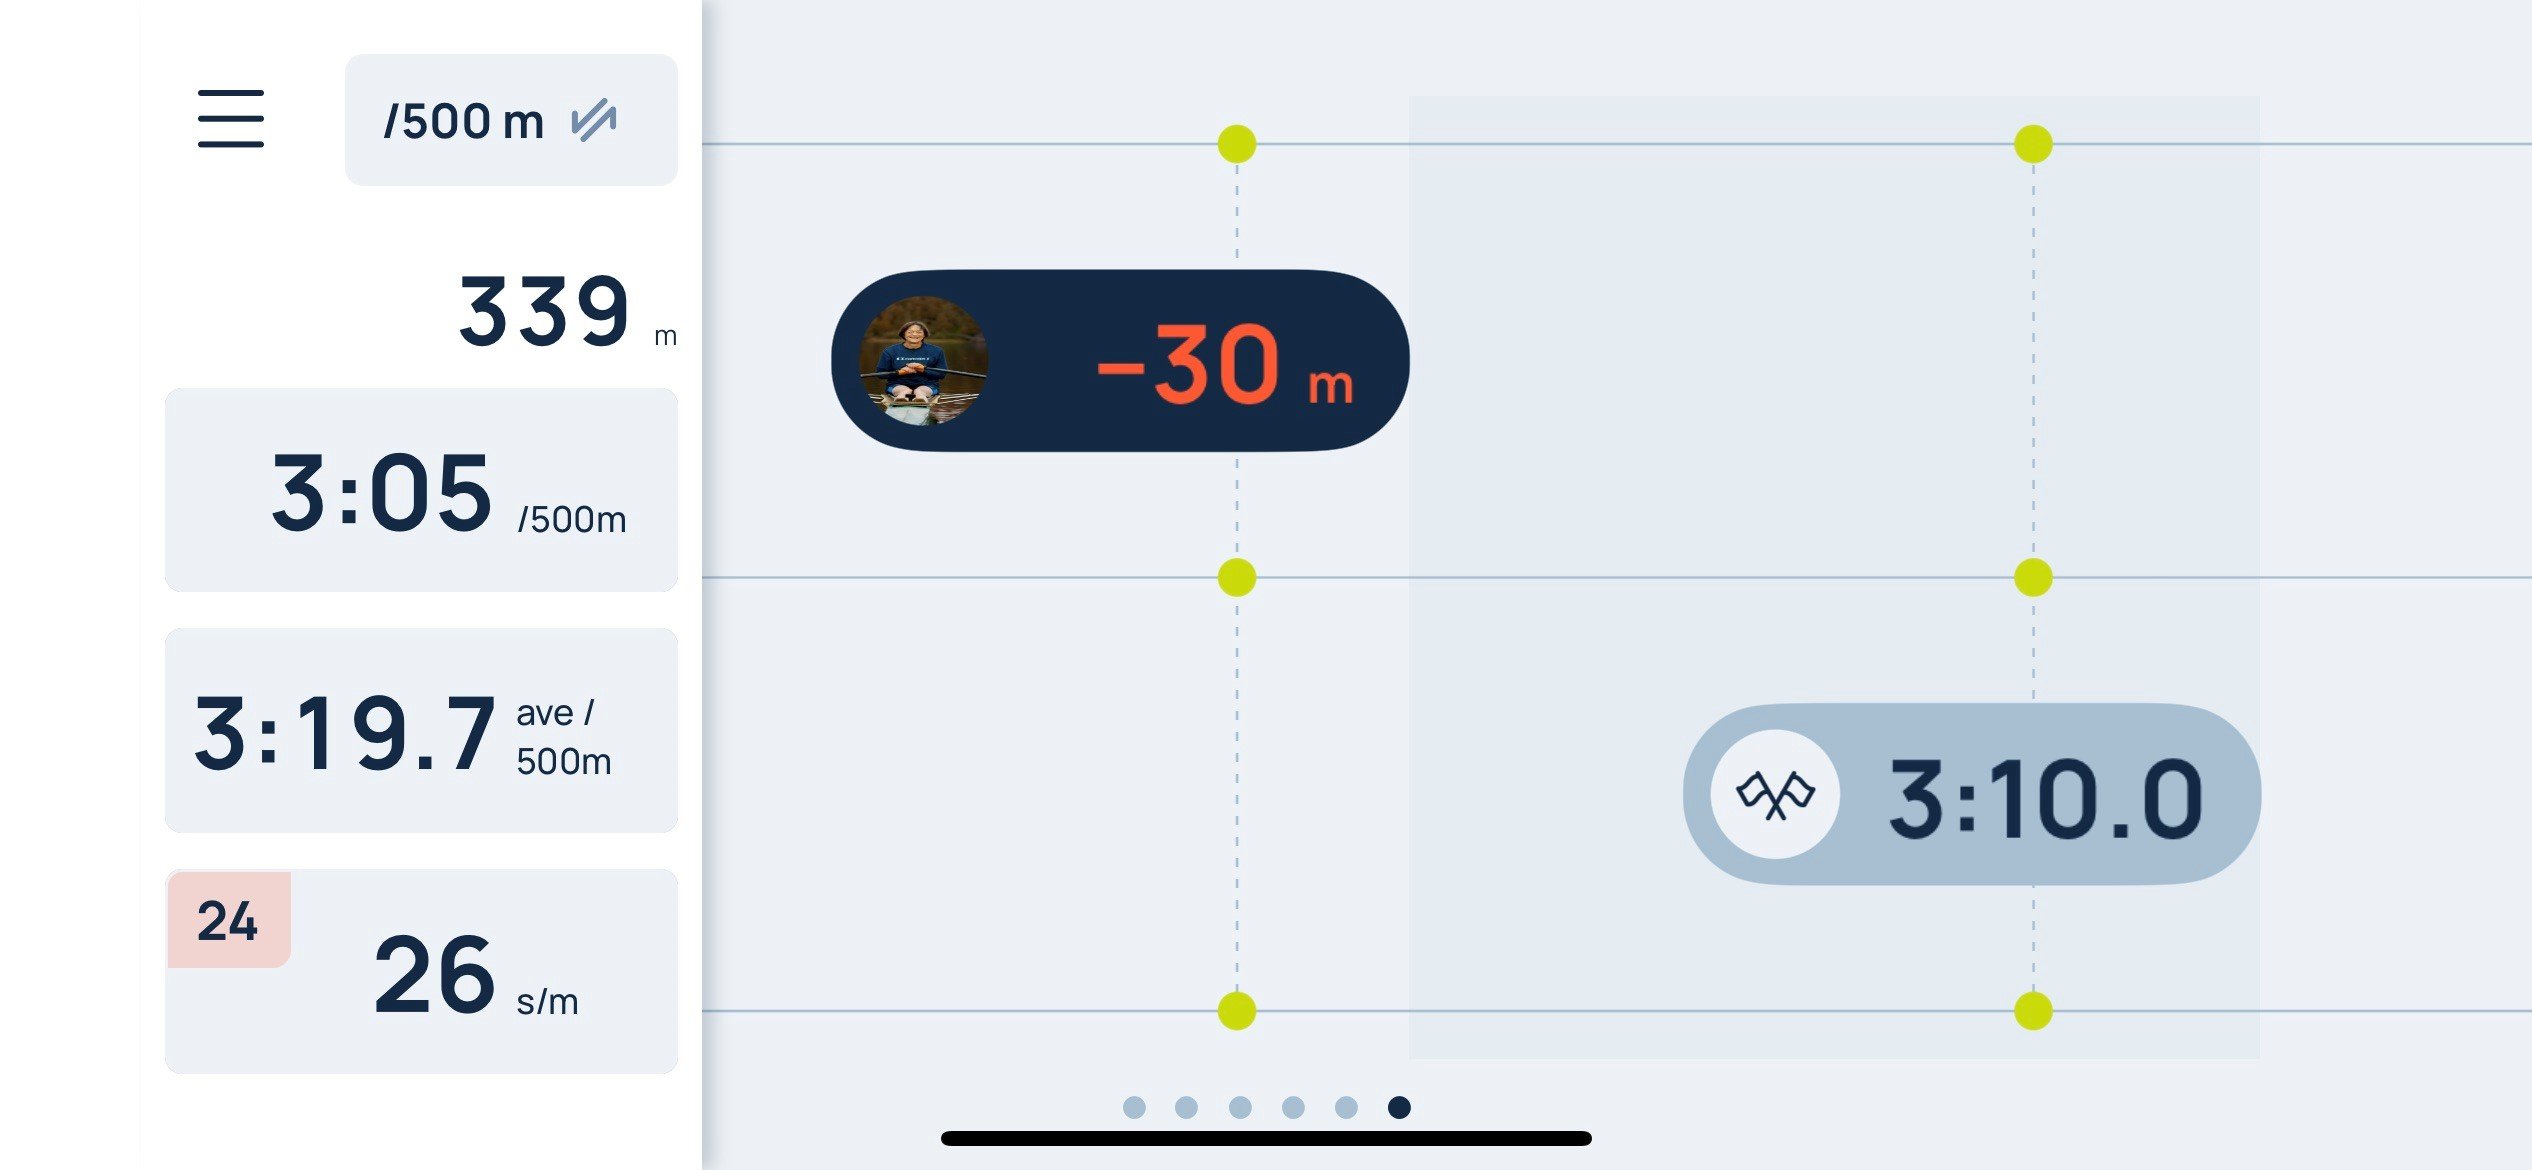
Pacer Graph Screen
So many data choices! Which ones are new?
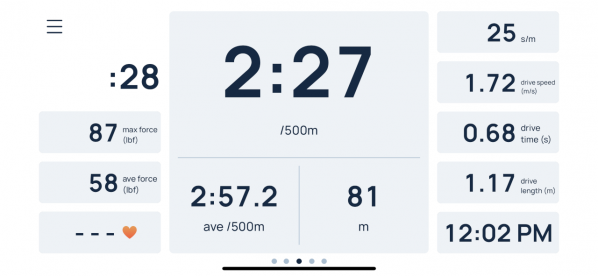
We have added drive ratio and time of day. The rest of these data choices have been available on both the PM and the first version of ErgData, but never have you been able to view so many at once (if you use the large data screen)—and even if you don’t want to watch them all at once, you can now choose which ones you want to see at the same time. For example, on the PM screen, you can choose to view data in pace, watts or Calories—but you can’t see several of these units at the same time. With Ergdata, you can now see all three at once. If you’re an on water rower working on improving your drive length, time and ratio, you can choose to have all of this data displayed while you row (see sample below).
More Advanced: Target Pace, Target Cadence and Target Heart Rate
You can set personal targets for pace, spm/rpm, and heart rate and they will be displayed as well. On the graph, a line will denote your target pace so that you can easily compare your actual to your target. For heart rate and spm/rpm, your target will be displayed along with your actual, and the target number will be bright red if you stray too far from your target!
We encourage you to download ErgData (it’s free) and explore the options that it offers. Take advantage of the ability to design a workout screen that is most helpful and informative to you. Going forward, ErgData will also offer more ways to connect to the Concept2 Training Community.
Recent Posts
Tags: